Paper #1, Part 3: The Simplest Way to Guess (Nearest Neighbor)
Before we build anything clever, let's try the dumbest possible approach to image classification. It's simpler than it sounds, and it teaches us something crucial about why this problem is hard.
Where we are: we have framed the task (Part 2), turning an image’s numbers into a label. Now we try the simplest possible way to do it.
In the last post, we talked about the problem: given a grid of numbers (an image), assign it a label from a fixed list (like “dog” or “cat”).
Now let’s try the simplest possible solution.
The Naive Idea
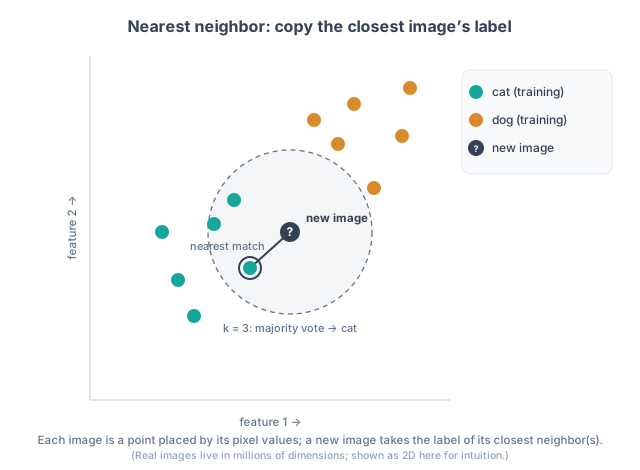
Here’s a strategy a child could understand: to classify a new image, find the image in your training set that looks most similar to it, and copy that image’s label.
That’s it. That’s the entire algorithm.
If you’re trying to classify a new photo of a dog, you find the training photo that’s most similar to it (pixel by pixel), and you guess “dog” because that’s what the training photo is labeled.
In machine learning, copying the single closest match is called nearest neighbor. The general version, where you look at the k closest matches and take a majority vote of their labels, is called k-nearest neighbors (kNN). It’s a common first algorithm to learn, because it’s easy to explain.
How Do You Measure “Similarity”?
The catch is: how do you define which images are similar?
Remember from Part 1: an image is just numbers. An 800 × 600 RGB image is 1.44 million numbers. Two images look similar to a human if they show the same thing from similar angles in similar lighting. But how do you turn that rough human sense of “looks similar” into a precise rule a computer can follow?
The simplest approach: compare the numbers directly.
If image A has pixel values [100, 150, 200] and image B has pixel values [101, 151, 199], they’re very close. If image C has pixel values [50, 50, 50], it’s far away.
CS231n teaches two standard ways to measure this distance.
L1 Distance (Manhattan Distance)
Add up the absolute differences between every pixel:
distance = |100 - 101| + |150 - 151| + |200 - 199|
         = 1 + 1 + 1
         = 3
This is simple and fast. For a full image, you’d add up the difference in every single pixel value across all 1.44 million numbers.
The name comes from Manhattan’s street grid: a taxi there can’t cut diagonally through buildings, so a trip is four blocks over plus three blocks up, the sum of the two legs. This formula measures distance the same way, one leg per pixel. “L1” is the mathematicians’ catalog label for it: the 1 means each difference is added in to the first power (raised to 1, which leaves it unchanged). L2, described below, raises each difference to the second power (squares it) before adding.
L2 Distance (Euclidean Distance)
Square the differences, add them up, then take the square root:
distance = sqrt((100 - 101)² + (150 - 151)² + (200 - 199)²)
         = sqrt(1 + 1 + 1)
         = sqrt(3)
         ≈ 1.73
This is the distance from high school geometry: the straight-line distance between two points. It’s called Euclidean after Euclidean geometry, the ordinary flat-space geometry going back to the Greek mathematician Euclid. It punishes large differences more than small ones (because of the squaring).
On the CIFAR-10 dataset (a standard benchmark of 60,000 small images: 50,000 for training and 10,000 for testing), L1 scored about 38% accuracy and L2 about 35%. That’s nearly four times better than random guessing (10% on 10 categories), and still nowhere near good enough to use.
Why This Fails
Nearest neighbor seems intuitive until you actually try it on real images. Then it falls apart.
The problem is pixel-level similarity is not semantic similarity. Two images can have very different numbers but show the same thing. Two images can have very similar numbers but show completely different things.
A dog photographed in shadow might have numbers [20, 25, 30] for a particular pixel. The same dog in bright sunlight might have [200, 210, 220] for that pixel. These numbers are nothing alike, even though it’s the same dog.
Meanwhile, a dog and a wolf can have very similar shapes, textures, and pixel values. If the nearest stored image to your wolf photo happens to be a dog, nearest neighbor confidently answers “dog.”
Nearest neighbor doesn’t care about what the pixels mean, just how close the numbers are. It matches based on accidental visual similarity (lighting, angle, background) rather than actual content.
This is why, as you add more challenging variations (viewpoint changes, scale changes, occlusion), nearest neighbor gets worse and worse. It’s trying to solve the problem with pixel arithmetic when the problem is fundamentally about semantic content.
The Insight
Nearest neighbor fails because it compares raw pixels, and raw pixels change with lighting, angle, and background. So any method that works well on real photos must first extract something deeper from the image: features or patterns that survive the seven challenges we listed in Part 2 (viewpoint, scale, lighting, occlusion, and the rest).
This is where the rest of CS231n comes in. Neural networks, and especially convolutional networks, learn to pull those deeper features out of the pixels and classify based on them rather than on the raw numbers. The linear classifier in the next post is a first improvement on nearest neighbor, but it still works on raw pixels, which is part of why it only goes so far.
What’s Next
In the next post, we’ll look at how to test a classifier without cheating. Once you’ve built one, you need to know if it actually works, and there’s a careful way to check and a misleading one. We’ll cover both.